
The beginning...

In January 1995, three state government agencies—California Air Resources Board, South Coast Air Quality Management District and California Energy Commission joined with six private sector companies—Ballard Power Systems, Daimler/Chrysler, Ford Motor Company, BP, Shell Hydrogen and Chevron/Texaco—to form the California Fuel Cell Partnership. The goal was to demonstrate and promote the potential for fuel cell vehicles (FCV) as a clean, safe, and practical alternative to vehicles powered by internal combustion engines. The CaFCP is an industry/government collaboration aimed at expanding the market for fuel cell electric vehicles powered by hydrogen to help create a cleaner, more energy-diverse future with no-compromise zero emission vehicles.
The state of California opened its first official hydrogen station in 2015. It was a First Element station. Since then there are now 50 stations opened throughout California and another 50 stations in different stages of planning. These can all be found on the CaFCP website. The Staff of the CaFCP from member organizations participate on standing committees and project teams that help ensure that vehicles, stations, regulations and people are in step with each other as the market grows. CaFCP’s success is directly linked to the commitment and involvement of our member organizations. As of January 2021 there are 12,456 hydrogen fuel HFCVs on the roadways of California.

In 2005 Norway announced the HyNor project between the cities of Oslo and Stavanger. "This project will provide a sensible means of providing hydrogen transportation along a test strip some 350 miles in length from the years 2005 to 2008. The project will also be quite challenging because of wide variations in climate and topology including very cold seasonal temperatures, not conducive to many fuel cell vehicles. The Norway HyNor Project was working with both governmental agencies as well as the private sector to produce this hydrogen corridor. The plans include the commercial feasibility of large-scale hydrogen fuel based vehicles such as cars, taxis, trucks and buses. Private vehicles will also be used in this globally anticipated study and fueling stations are slated to be completed so that a real-world test case can provide the evidence needed for a shift in the world’s fuel dependence.

In 2005 BMW introduced their 6.0 liter, 256 hp V12 hydrogen concept car - the BMW Hydrogen 7. It was duel-fuel - gasoline and liquid (cryogenic) hydrogen. The large hydrogen tank held 170 liters (45 US gallons) of fuel - 8 kilos. The BMW H7 had a mileage range of only 125 miles on hydrogen and but a combined range with both fuels of 400 miles. Only 100 cars were targeted to be manufactured as a finished working prototype car and given/leased to specific people for test trials and feedback of their experience. At the time there were only 5 hydrogen stations throughout Germany that could supply the BMW Hydrogen 7 car with the -253º C fuel. There was no particular plan to mass produce the Hydrogen 7.
On May 9, 2006, Quantum Fuel Systems announced that they have received an order from the Norway HyNor project for 15 Toyota Prius Hybrids to be converted to run on hydrogen gas. The vehicles will be put into service later in 2006 and in 2007 as part of the project. If the Norway HyNor Project is successful, a national infrastructure will be achieved in a few short  years with the well noted environmental benefits of hydrogen fuel firmly in place. In that moment, the world may begin to see a rapid readjustment to an entirely new fuel supply. The Honda FCX Clarity was rolled out at the 2007 Los Angeles Auto Show and was to be available as a lease vehicle to select customers in the summer of 2008. The first Tesla product, the Roadster sports car, debuted in 2008, followed by the Model S sedan, which was introduced in 2012.
The Honda FCX Clarity concept car was introduced in 2008 for leasing by customers in Japan and Southern California and discontinued by 2015. From 2008 to 2014, Honda leased a total of 45 FCX units in the US. Over 20 other FCEV prototypes and demonstration cars were released in that time period, including the GM HydroGen4 and Mercedes-Benz F-Cell. The Hyundai ix35 FCEV Fuel Cell vehicle was available for lease from 2014 to 2018,

November 2014 - the HFCV (Hydrogen Fuel Cell Vehicle) Toyota Mirai was unveiled at the Los Angeles Car Show. Under the United States Environmental Protection Agency (EPA) cycle, the 2016 model year Mirai has a total range of 502 km (312 mi) on a full tank, with a combined city/highway fuel economy rating of 66 mpg‑US (3.6 L/100 km; 79 mpg) equivalent (MPG-equivalent), making the Mirai the most fuel-efficient hydrogen fuel cell vehicle rated at the time by the EPA, and the one with the longest range. In August 2021, the second-generation Mirai set a world record of traveling 1,369 km )(845 miles) with a full tank of 5.65 kgs of hydrogen.

According to Toyota, the FCV features a fuel cell system with an output power density of 3.0 kW/L, which is twice as high as that of its previous fuel cell concept, the Toyota FCHV-adv, delivering an output power of more than 100 kW, despite significant unit downsizing. The FCV uses Toyota's proprietary, small, light-weight fuel cell stack and two 70 MPa high-pressure hydrogen tanks placed beneath the specially designed body. The Toyota FCV concept can accommodate up to four occupants. For the full-scale market launch in 2015, the cost of the fuel cell system is expected to be 95% lower than that of the 2008 Toyota FCHV-adv.
The Hydrogen Council- started in 2017 - is a global CEO-led initiative of 92 leading energy, transport, industry and investment companies with a united and long-term vision to develop the hydrogen economy. The key ambitions of the Hydrogen Council are to 1) accelerate significant investment in the development and commercialization of the hydrogen and fuel cell sectors and 2) encourage key stakeholders to increase their backing of hydrogen as part of the future energy mix. To mitigate the effects of climate change, we will need to transition to an energy system with fewer greenhouse gas emissions and more sustainable energy production and consumption. A long-term structural change in energy systems is needed, and Hydrogen Council members are developing hydrogen solutions to accelerate this energy transition.

As global leaders gathers at COP 23 in Bonn, 18 key leaders in their industry verticals, united in the Hydrogen Council coalition, came together to launch the first ever globally quantified vision of the role of hydrogen, developed with support from McKinsey. In addition to being a key pillar in of the energy transition, the study (Hydrogen, Scaling Up) shows hydrogen has the potential to develop US $2.5 trillion of business, creating more than 30 million jobs by 2050.
Brussels, 26 January 2022 – The Hydrogen Council, a global CEO-led coalition working to accelerate the energy transition through hydrogen, announced today eleven joining members. The organization now counts 134 companies from across the globe representing the entire hydrogen value chain and working towards the development of hydrogen solutions to foster the decarbonization of our economies. The Hydrogen Council brings together companies from a variety of sectors – including the automotive industry, chemicals producers, energy companies, engineers, investors and pension funds – committed to the development and implementation of hydrogen solutions that will play a fundamental role in building a clean and diversified energy system.
WASHINGTON, D.C. — February 5th, 2022 - The U.S. Department of Energy (DOE) today announced two Requests for Information (RFI) to collect feedback from stakeholders to inform the implementation and design of the Bipartisan Infrastructure Law’s Regional Hydrogen Hub and the Electrolysis and Clean Hydrogen Manufacturing and Recycling Programs. This request will help accelerate progress, reduce technology cost, and ramp up the use of hydrogen as a clean energy carrier. Clean hydrogen is crucial to DOE’s strategy for achieving President Biden’s goal of a 100% clean electrical grid by 2035 and net-zero carbon emissions by 2050.
“Clean hydrogen is key to cleaning up American manufacturing and slashing emissions from carbon-intensive materials like steel and cement while creating good-paying jobs for American workers,” said U.S. Secretary of Energy Jennifer M. Granholm. “We're seeking feedback from the American public on how to make scaling up this clean, affordable energy source a reality for the United States.”

Assembly Bill 1184 was introduced in 2017 that allowed for a $7,500 tax rebate from state government in California. This rebate program would bail out Tesla at taxpayer expense. It would be a rebate handled at the dealer, not a tax credit on the tax return. And it could reach “up to $30,000 to $40,000” per EV. This is the taxpayer-funded rebates in the “California Electric Vehicle Initiative.” For instance, a $100,000 Tesla might be deemed to have the same features as a $65,000 gas-powered car. The rebate would cover the difference, minus the federal rebate ($27,500). Because rebates for Teslas will soon be gone, the program would cover the entire difference – $35,000. This is where Senator Vidak got his “$30,000 to $40,000.” California Bill would boost electric car rebates by $3 Billion. Under AB1184, hybrids and hydrogen powered cars are not included, and rebates for plug-in hybrids are slashed – perhaps to keep Toyota’s technologies at bay.

"Hydrogen is an energy storage mechanism. It's not a source of energy," Musk said at a 2015 press conference. "Electrolysis is extremely inefficient as an energy process. If you took a solar panel and used the energy from that solar panel to just charge your battery pack directly compared to trying to split water, take the hydrogen, dump the oxygen, compress the hydrogen to an extremely high pressure or liquefy it and then put it in a car and run a fuel cell, it is about half the efficiency. It's terrible." Adding, "Fuel cells = fool sells." Musk tweeted on June 10, 2020 "Staggeringly dumb," he continued. As CNBC noted, Musk has previously "dismissed hydrogen fuel cells as 'mind-bogglingly stupid.'" He has also "called them a 'load of rubbish,' and told Tesla shareholders at an annual meeting years ago that 'success is simply not possible." Clearly, Musk is not a fan of hydrogen fuel cells — at least not for use in cars — which makes sense since he built the Tesla empire on lithium-ion batteries. What Musk and other pro BEV proponents will never tell the public can be found here. The dirty little secret about BEVs.
The battle of the ZEVs
The HFC Toyota Mirai
Under the United States Environmental Protection Agency (EPA) cycle, the 2016 model year Mirai has a range of 502 km (312 mi) on a full tank, with a combined city/highway fuel economy rating of 66 mpg‑US (3.6 L/100 km; 79 mpg) equivalent (MPG-equivalent). The official Toyota consumption declaration states hydrogen is consumed at the rate of 0.8 kg/100 km (2.8 lb/100 miles) on the combined urban/extra urban cycle.

The first generation of Toyota FC Stack achieved a maximum output of 114 kW (153 hp). Electricity generation efficiency was enhanced through the use of 3D fine mesh flow channels. These channels—a world first, according to Toyota—we're arranged in a fine three-dimensional lattice structure to enhance the dispersion of air (oxygen), thereby enabling uniform generation of electricity on cell surfaces. This, in turn, provided a compact size and a high level of performance, including the stack's world-leading power output density of 3.1 kW/L (2.2 times higher than that of the previous Toyota FCHV-adv limited-lease model), or 2.0 kW/kg. Each stack comprises 370 (single-line stacking) cells, with a cell thickness of 1.34 mm and weight of 102 g. The compact Mirai FC stack generates about 160 times more power than the residential fuel cells on sale in Japan. The Mirai has a new compact (13-liter), high-efficiency, high-capacity converter developed to boost voltage generated in the Toyota FC Stack to 650 volts.
The Mirai has two hydrogen tanks with a three-layer structure made of carbon fiber-reinforced plastic consisting of nylon 6 from Ube Industries and other materials. The tanks are 122 liter combined, and store hydrogen at 70 MPa (10,000 psi). The tanks have a combined weight of 87.5 kg (193 lb) and 5 kg capacity. Toyota's latest generation hybrid components were used extensively in the fuel cell powertrain, including the electric motor, power control and main battery. The electric traction motor delivers 113 kilowatts (152 hp) and 335 N⋅m (247 lbf⋅ft) of torque. The Mirai has a 245V (1.6 kWh) sealed nickel-metal hydride (NiMH) traction rechargeable battery pack, similar to the one used in the Camry hybrid. The Mirai also carries the added purchase incentive of three years/$15,000 of free fuel.
The Tesla BEV - an interesting history

In 2003 Tesla, Inc., an electric vehicle manufacturer was founded in San Carlos, California in 2003 by American entrepreneurs Martin Eberhard and Marc Tarpenning. The two owners decided to launch the company after GM recalled the EV1 and destroyed them - also in 2003. Eberhard said he wanted to build "a car manufacturer that is also a technology company", with its core technologies as "the battery, the computer software, and the proprietary motor". Ian Wright was the third employee, joining a few months later. Elon Musk was just a VC - who in 2004 invested $6.5 million in a first round financing and another $7.4 million later in 2004 and made himself Chairman of the Board. JB Straubel joined the team later in 2004. A lawsuit settlement agreed to by Eberhard and Tesla in September 2009 allows all five (Eberhard, Tarpenning, Wright, Musk and Straubel) to call themselves co-founders. Elon Musk wanted to be known as a co-founder so badly that it took a lawsuit with the real founders for him to be listed as one! In 2009, Eberhard filed a lawsuit against Musk for slander and libel. As per NBC Bay Area, "the lawsuit was settled, and as a condition of the settlement, Musk and two other Tesla executives, JB Straubel and Ian Wright, are now allowed to call themselves co-founders, in addition to Eberhard and Tarpenning." With his investment, Elon Musk had become Chairman of the Board, but by 2007, as per media reports, Eberhard was pushed out and subsequently sued the company. Another undisclosed settlement agreement forced upon the original founders by Elon Musk.
The company’s brash, tech-savvy CEO, Martin Eberhard, declared that Silicon Valley ingenuity would teach Detroit’s auto giants how to make compelling zero-emission cars. Marc Tarpenning of Tesla told the audience of entrepreneurs at StartUp Grind Global Conference, "to think big. It means going to look for those problems that need solutions and focusing on the issues that have real meaning." Both Tarpenning and Eberhard started Tesla Motors as a solution to the emissions issues conventional cars had. In 2014 - now CEO and Chairman of the Board with Tarpenning and Eberhard out of Tesla, Elon Musk openly described hydrogen fuel cells as "mind-boggingly stupid," "incredibly dumb," and "fool cells." It was no coincidence his statements corresponded that year (2014) with the release of the Toyota Mirai.

The first Tesla product, the Roadster sports car, debuted in 2008. In June 2009, Tesla was approved to receive $465 million in interest-bearing loans from the United States Department of Energy. The funding, part of the $8 billion Advanced Technology Vehicles Manufacturing Loan Program, supported engineering and production of the Model S sedan, as well as the development of commercial power train technology. Tesla repaid the loan in May 2013, with $12 million interest. The Tesla Model S sedan was introduced in 2012. Tesla began shipping its third vehicle, the luxury SUV Tesla Model X, in September 2015 and began selling its fourth vehicle model, the Model 3 sedan, in July 2017. The Model Y was unveiled on March 14, 2019. In 2021 the Plaid Version of the Model S was introduced. The Tesla Model 3 has become the first all-electric car to become the best-selling vehicle in Europe. However, that’s on a monthly basis and Tesla’s deliveries vary widely on a monthly basis. Last quarter, Tesla delivered a record number of vehicles – getting close to a quarter of million vehicles.
The Power Train Model 3 and Charging times:
- Options dual motor or all-wheel drive (AWD),
- The rear-wheel-drive Long Range model we tested sprinted from zero to 60 mph in 5.1 seconds. The Model 3 Performance rockets to 60 mph in just 3.5 seconds
- The battery capacity of the Tesla Model S ranges from 100 kWh on newer models to 104 kWh on older models,
- The vehicle is rated at a maximum range of about 368 miles but in actuality will travel only 320 miles at 75 mph,
- The long range Tesla Model 3 variations are rated at 390, 412 and 520 miles
- The vehicle consumes around 0.27 to 0.28 kWh per mile.
- Level 1 charging is the universal charging option. If there is a standard wall socket nearby, you will be able to
 charge your Tesla with that. With that said, 120V is the bare minimum amount of juice you can pull into your EV. So if you’re wondering how long it would take to charge your 2021 Tesla Long Range Model 3, you’re looking at a 20-40 hours.
 - Level 2 chargers are the most common type found at third-party public charging stations, although DC fast chargers continue to expand their presence (more of them in a minute). At home, 240V plugs usually offer around 40 amps but can go as high as 80 and are usually more specifically placed compared to standard 120V outlets. Think of this charger as the equivalent to your dryer or other large appliance. Tesla suggests owners install a Level 2 charger in their home or garage if they can. This is fairly easy for an electrician or specialist to come and install. At Level 2, you’re looking at much quicker speeds compared to Level 1. We’re talking 8 - 10 hours
- The Tesla Supercharger network is a combined group of proprietary charging stations developed and implemented by Tesla. Currently, most Tesla Superchargers can now recharge up to 200 miles of range in just 15 -25 minutes, depending on the rate of charge. These DC charging speeds range from 90 kW to 250 kW, depending on which Supercharger pile you’re at. These Level 3 chargers abandon the alternating current (AC) methods above to mainline power directly. While they require a lot more power from the grid (480+ volts and 100+ amps), their output is truly “super.” Superchargers can recharge a vehicle’s battery up to 80% in just about 40 minutes. To charge a Tesla Model 3 from 0 - 100% will take close to 3 hours.

If the long charging times are not disruptive to your travel schedules this well known "Phantom Drain" is yet another element on the power equation that is not normally considered in the entire energy equation of power and efficiencies losses experienced by all Tesla owners. Your Tesla loses range when parked caused by something called "Phantom battery drain" or just "Phantom drain". This can vary from a few miles per day to quite significant amounts depending on the settings in the car and can be a problem if leaving your car while on holiday. If you consider the 12% - 15% energy losses - noted by Car and Driver - while charging coupled with the power losses by design and operation of a Tesla electrical system - it quickly becomes obvious there is far more than meets the eye financially with BEV ownership other than what is the big selling points of EV manufacturers. Cold weather dramatically reduces range. In very cold climates in winter (Minnesota), range drops by about 30%. In mild winter conditions (California), you should expect 15% loss. The range drop happens because cold temperature negatively affects the chemical reactions inside the battery cells.

Also considering the advice from Tesla recommendations, "For regular use, we recommend keeping your car set within the 'Daily' range bracket, up to approximately 90%. Charging up to 100% is best saved for when you are preparing for a longer trip." But Tesla doesn't say why this 90% is a daily benchmark. A common practice among Tesla owners is the "20 - 80 rule". Do not let the battery capacity drop below 20% before recharging and do not go above 80% for a "full charge of 100% unless on long trips". Therefore - not only are there big losses due to the electrical conversions "12% - 15% and "Phantom battery loss" but you also lose 40% of your driving range by merely not over taxing the battery in charging. Lest we forget - the Car and Driver report of, "7% battery capacity loss at 24,000 miles".

With the Tesla Model 3 comes a "8 years or 100,000 miles, whichever comes first, with minimum 70% retention of Battery capacity over the warranty period." and "8 years or 120,000 miles, whichever comes first, with minimum 70% retention of Battery capacity over the warranty period." So in essence you'll lose 30% of your battery capacity and range within that time/mileage rating.
Also on the Tesla website if a batter does fail before the expiration of 8 years of 70% capacity they will exchange your battery for a similar "battery capacity" and/or condition. They won't exchange your depleted battery with a new battery. Its a "like for like" exchange. And IF a Tesla battery did fail after warranty expiration the cost of replacing - according to the Tesla Community - that battery replacement cost is $12 - $14K.
Hydrogen Compression
Hydrogen is typically produced at relatively low pressures (20–30 bar) and must be compressed prior to transport. Most compressors used today for gaseous hydrogen compression are either positive 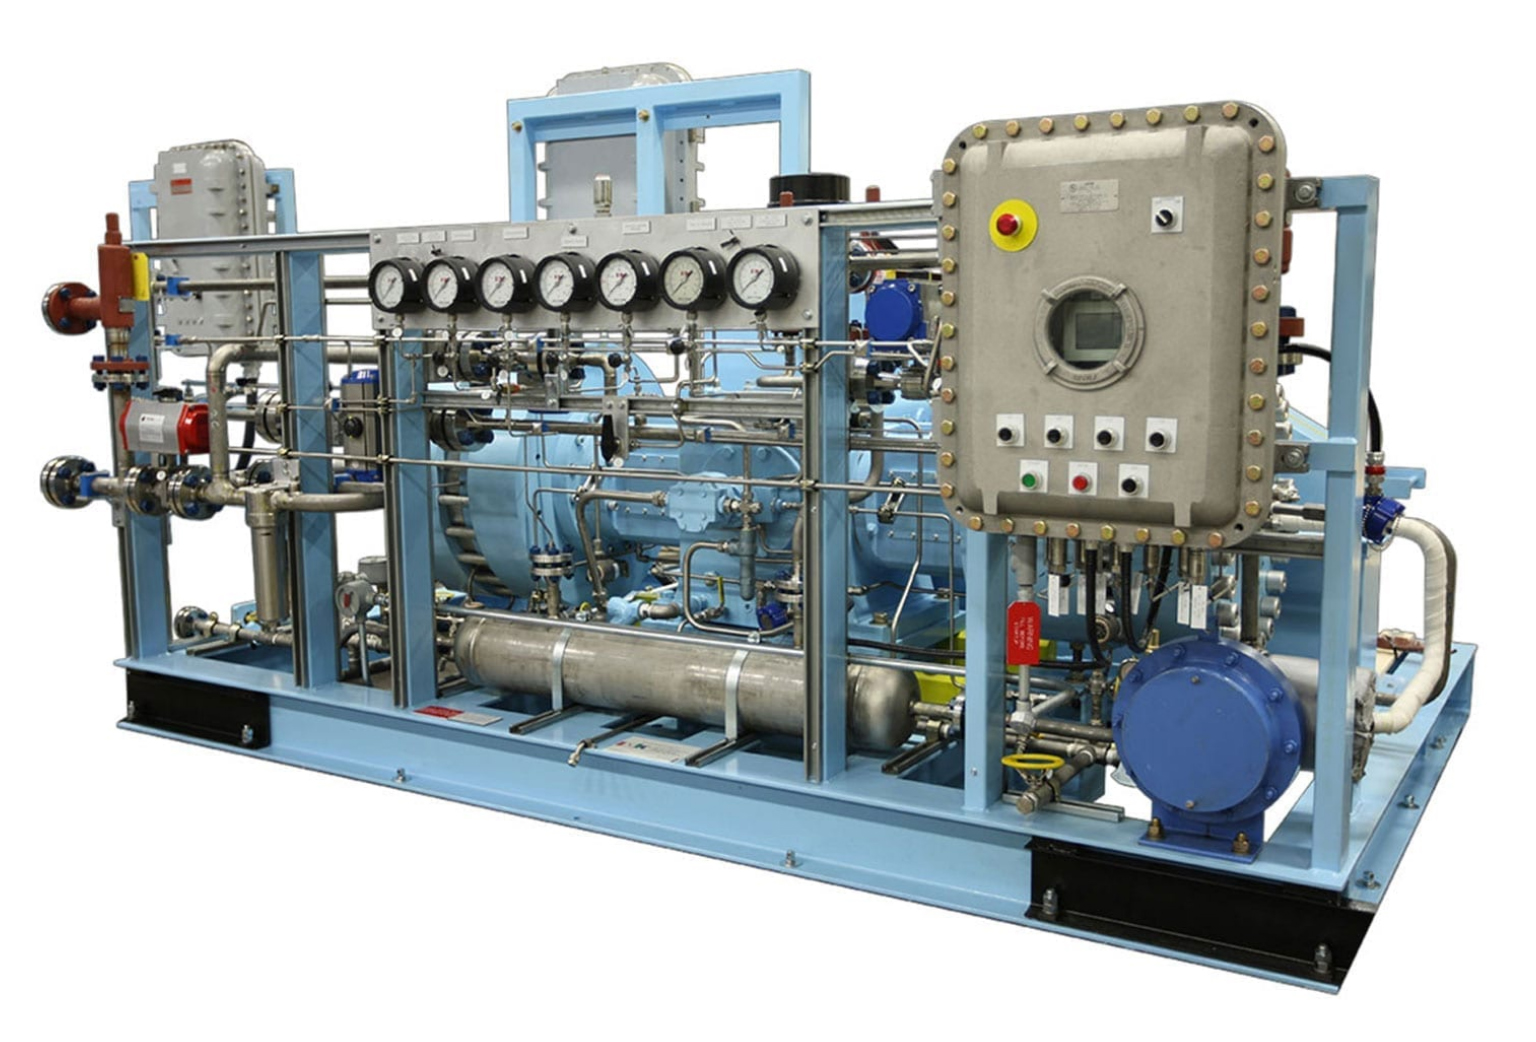 displacement compressors or centrifugal compressors. Positive displacement compressors can be reciprocating or rotary.
- Reciprocating compressors use a motor with a linear drive to move a piston or a diaphragm back and forth. This motion compresses the hydrogen by reducing the volume it occupies. Reciprocating compressors, sometimes called "recipes" for short, are the most commonly used compressor for applications that require a very high compression ratio.1
- Rotary compressors compress through the rotation of gears, lobes, screws, vanes, or rollers. Hydrogen compression is a challenging application for positive displacement compressors due to the tight tolerances needed to prevent leakage.
- Ionic compressors are similar to reciprocating compressors but use ionic liquids in place of the piston. These compressors do not require bearings and seals, two of the common sources of failure in reciprocating compressors. Ionic compressors are available today at the capacities and pressures required at hydrogen fueling stations.
- Centrifugal compressors are the compressor of choice for pipeline applications due to their high throughput2 and moderate compression ratio. Centrifugal compressors rotate a turbine at very high speeds to compress the gas. Hydrogen centrifugal compressors must operate at tip speeds 3 times faster than that of natural gas compressors to achieve the same compression ratio because of the low molecular weight of hydrogen.

The energy required to compress hydrogen from 20- 30 bar is system dependent. As there are industry standards in production of hydrogen - there are standards accepted for compression to 350 bar (5000 psi) and 700 bar (10,000 psi). Theoretical minimum energy requirements are determined from energy differences using the standard properties of “normal” hydrogen (25% para-H2 spin isomer) as reported by the National Institute of Standards (NIST) [1]. In all cases it is assumed that H2 gas is initially generated at 20 bar (290 psi). The theoretical energy to compress hydrogen isothermally from 20 bar to 350 bar (5,000 psi or ~35 MPa) is 1.05 kWh/kg H2 and only 1.36 kWh/kg H2 for 700 bar (10,000 psi or ~ 70 MPa). Greater compression energies are required to fill vehicles in practice due to compressor inefficiencies and heating during fast fills. DOE Technology Validation Project data for compression from on-site H2 production is 1.7 to 6.4 kWh/kgH2. Additional energy required for pre-cooling (as cold as -40 C)[3] to ensure on board fast fill temperatures are 85 C or lower can be modest (0.15 kWh/kg H2).
Due to compression heating, over-pressures are required to achieve a complete fill when rapidly refueling with high pressure H2 gas. A 350 bar system can require an over-pressure as high as 440 bar and the maximum vessel temperature must be limited to 85º. Pre-cooling is not usually needed for 350 bar fills of 5 kg H2 in less than 5 minutes. Several factors contribute to the need for pre-coolng. Some examples are ambient temperature, tank capacity, design, and vessel Type. Aluminum lined Type III vessels have faster heat transfer from the warm gas and more heat capacity than Type IV vessels with polymer liners. The latest draft of the document SAEJ2601 (Compressed Hydrogen Vehicle Fueling Communication Device) lists pre-cooling for 350 bar vehicles. 700 bar fast fill systems can require an over-pressure as high as 880 bar with pre-cooling as low as -40oC (233 Kelvin).

The energy required for storage of hydrogen at three different conditions (350 bar, 700 bar, 1 bar at 20 Kelvin) are the very modest theoretical storage energies. Compressing hydrogen (isothermally) from 20 bar to 350 bar requires just 1.05 kWh/kg H2, with an additional 0.10 kWh/kg H2 to reach a refueling pressure of 440 bar. Only 1.35 kWh/kg H2 is required for compression to 700 bar, with an additional 0.12 kWh/kg H2 to reach a refueling pressure of 880 bar.
Currently, hydrogen is typically compressed by a reciprocal compressor. At the flow rates and pressures for 1,000 kg/day hydrogen refueling stations, these compressors can achieve an isentropic efficiency of about 56% and a motor efficiency of 92% [5]. Using these values, the H2A Delivery Scenario Model (HDSAM) projects a refueling station compression energy efficiency of 52% to fill 350 and 49% for 700 bar vehicles. This corresponds to an energy use of 2.23 and 3.0 kWh/kg H2 for compression to 440 bar and 880 bar respectively. Existing DOE Technology Validation hydrogen demonstration refueling sites have experienced an average compression energy of 3.1 kWh/kg H2. Air Products and Chemicals Inc. (APCI) estimates the need for 2.67 kWh/kg compression energy to 880 bar. They estimate the pre-cooling energy required to cool hydrogen from 30º C to -20o C for a 700 bar refueling to be 0.18 kWh/kg H2.
Hydrogen Transportation
A viable hydrogen infrastructure requires that hydrogen be able to be delivered from where it is produced to the point of end use, such as an industrial facility, power generator, or fueling station. Infrastructure includes the pipelines, liquefaction plants, trucks, storage facilities, compressors, and dispensers involved in the process of delivering fuel.

Delivery technology for hydrogen infrastructure is currently available commercially, and several U.S. companies deliver bulk hydrogen today. Growth in hydrogen demand will require regional expansion of this infrastructure and development of new technologies, such as chemical carriers to transport hydrogen at high density and high-throughput fueling technologies for heavy-duty fuel cell transportation.
Hydrogen is not just the smallest element on earth, it is also the lightest—as a point of comparison, the mass one gallon of gasoline is approximately 2.75 kg where one gallon of hydrogen has a mass of only 0.00075 kg (at 1 atm pressure and 0°C). In order to transport large amounts of hydrogen it must be either pressurized and delivered as a compressed gas, or liquefied. Where the hydrogen is produced can have a big impact on the cost and best method of delivery. For example, a large, centrally located hydrogen production facility can produce hydrogen at a lower cost because it is producing more, but it costs more to deliver the hydrogen because the point of use is farther away. In comparison, distributed production facilities produce hydrogen on site so delivery costs are relatively low, but the cost to produce the hydrogen is likely to be higher because production volumes are less.
Today, hydrogen is transported from the point of production to the point of use via pipeline and over the road in cryogenic liquid tanker trucks or gaseous tube trailers. Pipelines are deployed in regions with substantial demand (hundreds of tons per day) that is expected to remain stable for decades. Liquefaction plants, liquid tankers, and tube trailers are deployed in regions where demand is at a smaller scale or emerging. Demonstrations of hydrogen delivery via chemical carriers (e.g., in barges) are also underway in large-scale applications, such as export markets.
At the point of hydrogen use, additional infrastructure components that are commonly deployed include compression, storage, dispensers, meters, and contaminant detection and purification technologies. For example, stations being deployed to dispense hydrogen into medium- and heavy-duty fuel cell vehicles are expected to compress the hydrogen to 350–700 bar pressure and dispense at up to 10 kg/min. High-throughput technologies to meet these performance requirements are currently under development.
Tube Trucks

Gaseous hydrogen is most commonly delivered either by trucks or through pipelines. Because gaseous hydrogen is typically produced at relatively low pressures (20–30 bar), it must be compressed prior to transport. Trucks that haul gaseous hydrogen are called "tube trailers". Gaseous hydrogen is compressed to pressures of 180 bar (~2,600 psi) or higher into long cylinders which are stacked on the trailer that the truck hauls. This gives the appearance of long tubes, hence the name tube trailer. Gaseous hydrogen can also be transported through pipelines much the way natural gas is today. This is common for long distance and high volume transport. Most existing hydrogen pipelines are installed at oil refiners as hydrogen is used in the petroleum upgrading process.
The current practice is delivery of compressed H2 using tube trailers. The carrying capacity of the trailers determines the required capital investment, while the operating costs per unit of H2 delivered depend on both the carrying capacity and the delivery distance. Global regulations currently limit the pressure to 20 MPa, although higher-pressure tube trailers (T4 tube trailers based on a new type of carbon-fiber construction capable of 54 MPa) are progressing through the regulatory-approvals process in the USA. Further progress is possible through engineering maturity and manufacturing gains from larger-scale production, but increasing pressure capabilities in current tube-trailer architectures is expected to reach a point of diminishing cost returns due to the additional fiber required to prevent fatigue failure at higher pressures.
Pipeline

Transporting gaseous hydrogen via existing pipelines is a low-cost option for delivering large volumes of hydrogen. The high initial capital costs of new pipeline construction constitute a major barrier to expanding hydrogen pipeline delivery infrastructure. Research today therefore focuses on overcoming technical concerns related to pipeline transmission, including:
- The potential for hydrogen to embrittle the steel and welds used to fabricate the pipelines
- The need to control hydrogen permeation and leaks
- The need for lower cost, more reliable, and more durable hydrogen compression technology.
Potential solutions include using fiber reinforced polymer (FRP) pipelines for hydrogen distribution. The installation costs for FRP pipelines are about 20% less than that of steel pipelines because the FRP can be obtained in sections that are much longer than steel, minimizing welding requirements.
One possibility for rapidly expanding the hydrogen delivery infrastructure is to adapt part of the natural gas delivery infrastructure to accommodate hydrogen. Converting natural gas pipelines to carry a blend of natural gas and hydrogen (up to about 15% hydrogen) may require only modest modifications to the pipeline. Converting existing natural gas pipelines to deliver pure hydrogen may require more substantial modifications. Current research and analyses are examining both approaches.
Liquefaction
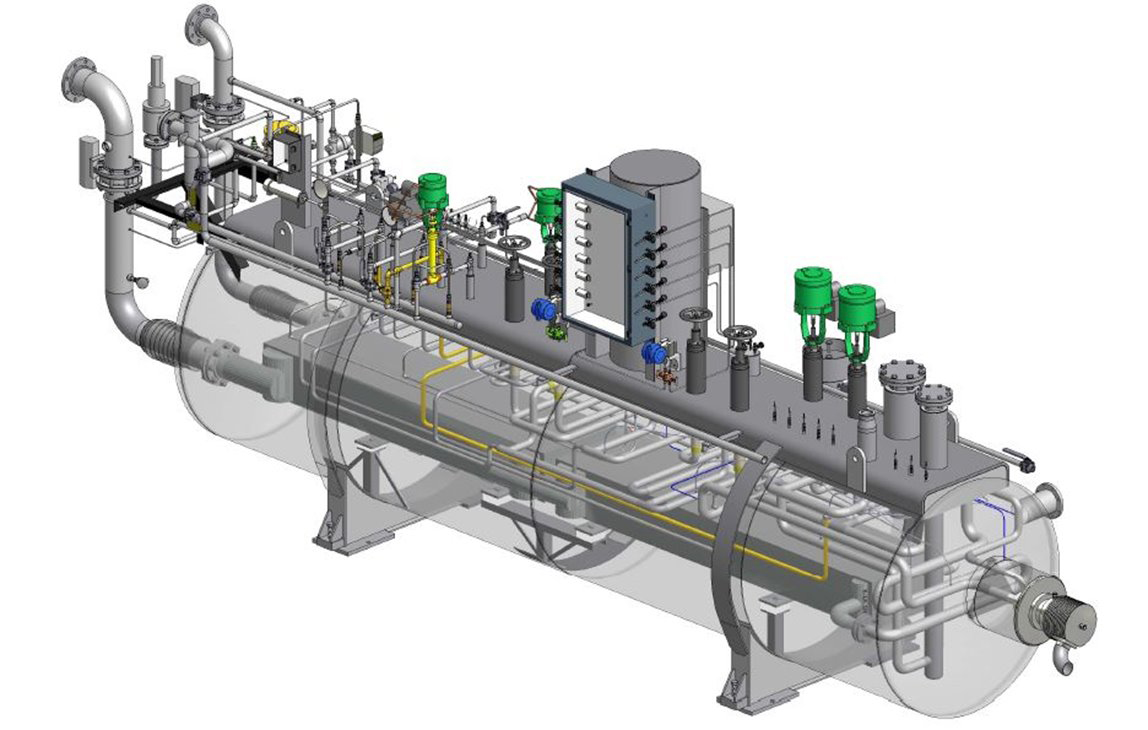
Demand for hydrogen in emerging and growing sectors, such as light-duty fuel cell electric vehicles (FCEVs) and material handling equipment, will require construction of new large-scale hydrogen production and distribution infrastructure. Liquid hydrogen supply is often desired due to its higher energy density compared to gaseous hydrogen and lower cost at high volumes [1].5 To meet the expected growth in demand, gas supply companies have recently announced plans to develop four new liquefaction plants [2–5], which are expected to increase the U.S. liquid hydrogen production capacity by at least 40%.
Gaseous hydrogen is liquefied by cooling it to below −253°C (−423°F). Once hydrogen is liquefied it can be stored at the liquefaction plant in large insulated tanks. It takes energy to liquefy hydrogen—using today's technology, liquefaction consumes more than 30% of the energy content of the hydrogen and is expensive. In addition, some amount of stored hydrogen will be lost through evaporation, or "boil off" of liquefied hydrogen, especially when using small tanks with large surface-to-volume ratios. Research to improve liquefaction technology, as well as improved economies of scale, could help lower the energy required and the cost.
Currently, for longer distances, hydrogen is transported as a liquid in super-insulated, cryogenic tanker trucks. After liquefaction, the liquid hydrogen is dispensed to delivery trucks and transported to distribution sites where it is vaporized to a high-pressure gaseous product for dispensing. Over long distances, trucking liquid hydrogen is more economical than trucking gaseous hydrogen because a liquid tanker truck can hold a much larger mass of hydrogen than a gaseous tube trailer can. Challenges with liquid transportation include the potential for boil-off during delivery.

The theoretical minimum energy requirement to produce liquid hydrogen, in a reversible Carnot process,is 2.88 kWh/kg, assuming an inlet pressure of 20 bar. Twenty bar is the typical outlet pressure of steam methane reformers (SMR), which are primarily used to produce hydrogen for current liquefaction plants.Today’s industrial liquefiers, however, have an energy requirement in the range of 10–20 kWh/kg.
Based on the improved Claude pre-cooling cycle combined with Joule–Brayton refrigeration cycle, a hydrogen liquefaction process with high efficiency and mixed refrigerants is developed. Four independent refrigeration cycles with nitrogen and three different mixed refrigerants are used. By this process, 288.92 tons gaseous hydrogen (25 °C, 21 bar) can be transferred into liquid hydrogen (−253.4 °C, 1.3 bar), and the coefficient of performance (COP), specific energy consumption (SEC) and energy efficiency are 0.1574, 5.85 kWh/kgLH2 and 55.30%, respectively. Based on the sensitivity analysis, the SEC is reduced to 5.742 kWh/kgLH2, the COP increases to 0.1602, and their variations account for 1.85% and 1.78%, respectively.
The Whole Picture

It is widely known hydrogen opponent's weapon of choice is the efficiency differences between BEV and HFCVs. These equations are composed of several different elements that once compiled - supposedly add up to some dismal end game that disqualifies hydrogen as a viable and powerful solution to the world's clean energy and zero emission fuel vehicles. There are several complicated math equations and totals that are used in this lopsided comparison when it comes to what energy feed stock goes in, what hydrogen production technology is used, i.e. SMR, Electrolysis or Gasification and how much energy is consumed or produced from production to compression, transportation and fuel cell and electronics efficiency e.g. "Wells to Wheels."
In 100% of the cases - according to hydrogen opponents there is a massive imbalance between HFCVs and BEVs when it comes to efficiencies and energy consumption like a 350 pound Sumo wrestler on one side and a 200 lbs Senior High School wrestler on the other side of the ring. This little exercise is to look at all the aspects of incoming power supplies, electrical transmission, operating efficiency levels, electrical conversions, energy losses, battery parasitic energy, fuel cell efficiencies, power train loses AND emissions before and after electron discharge to the motors.
Apparently Team SUMO is under the assumption the classification of ZEV (Zero Emission Vehicle) should only apply to BEVs since there is no tail pipe. But this is the farthest from the truth when it comes to reversing the total equation BEFORE one electron goes into the battery, i.e. "from Wheels to Well or Mine". BTW - all batteries get charged up BEFORE they leave the factory and this is a huge power draw on the fossil based electrical grid at the factory.
According to the EIA, In 2020, about 4,007 billion kilowatt hours (kWh) (or about 4.01 trillion kWh) of electricity were generated at utility-scale electricity generation facilities in the United States. About 61% of this electricity generation was from fossil fuels—coal, natural gas, petroleum, and other gases. About 20% was from nuclear energy, and only 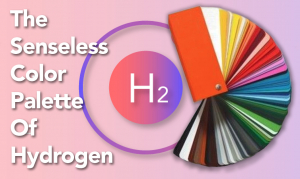 about 12% was from renewable energy sources. Of that "12% renewable" of the entire US energy consumption source in the US - only 9% was produced from solar and 24% of the 12% of RE energy consumed was from wind power . So basically - trying to find a clean electron produced by RE either at home (bar your own off-grid rooftop solar) or at charging stations to charge a battery of a BEV is like trying to find a needle in 3000 square miles of Yellowstone National Park. They're out there somewhere in an endless string of 1000s of miles long transmission lines and substations but finding them is a roll of the dice.
Saying that - the hydrogen opponents - with help from the media - to try and prove a point from the inability to truly understand hydrogen - a color palette was created to help classify almost all resources of hydrogen as "unfit for public consumption" - except "green hydrogen". According to hydrogen opponents that assigned color also has its caveats. But what these very same people refuse to relent on is the fact that the very same electrons that are used to produce hydrogen - either via SMR or Electrolysis - are the very same electrons used to charge up a BEV battery. Therefore - since hydrogen opponents claim natural gas as a CO2 spewing resource to produce hydrogen - the national grid to charge a battery of a BEV is 40.5% natural gas powered.
According to THE NEW recent study published by Cornell and Stanford University researchers in August (theoretically) found that the greenhouse gas footprint of blue hydrogen is more than 20 percent greater than burning natural gas or coal for heat - highly debatable of how they actually carried out the research and drew their conclusions that is filled with a lot of "could bes", "can bes" and "maybes", "could indicate" and "default assumptions" and "estimating" - mostly theoretical modeling data except the math of methane consumed and CO2 emissions per MJ of hydrogen produced during the SMR process - including the misinformation of the authors claims, "The Hydrogen Council, a group established in 2017 by British Petroleum, Shell, and other oil and gas majors" - not only is this report is misleading by claiming "Shell (oil) company" when in fact it was Shell Hydrogen - this report intentionally does not point out the original hydrogen related inaugural members that included: Air Liquide, Alstom, Anglo American plc, BMW, Daimler AG, ENGIE, Honda, Hyundai Motor Company, Kawasaki Heavy Industries, The Linde Group, Total S.A., and Toyota Motor Corporation. These hydrogen related companies that were part of the 13 original members started the Hydrogen Council outweighed fossil related members and still does in 2022. But then when a Professor from Standford is considered and expert in renewable energy - it becomes clear the agenda, "Mark Z. Jacobson’s career has focused on better understanding air pollution and global warming problems and developing large-scale clean, renewable energy solutions to them. Toward that end, he has developed and applied three-dimensional atmosphere-biosphere-ocean computer models and solvers to simulate air pollution, weather, climate, and renewable energy," and subsequently as co-author of the report, "as an Oceanographer - Professor Howarth, R.W. 2015. Perspectives on air emissions of methane and climatic warming risk from hydraulic fracturing and shale-gas development: Implications for policy. Energy & Emission Control Technologies 3: 45-54" apparently qualifies him as being a hydrogen expert. I'm wondering if either of these two professors actually went out and physically measured the CO2 emissions and the "fugitive methane emissions" from the feed lines to SMR systems? OR was all the data for this "new study" just accumulated in front of a computer screen?
According to the data from above mentioned report, "Blue hydrogen differs from gray hydrogen in that, with blue hydrogen, some of the carbon dioxide released by the SMR process is captured. In another version of the blue-hydrogen process, additional carbon dioxide is removed from the flue gases created from burning natural gas to provide the heat and high pressure needed to drive the SMR process. A third set of emissions, not usually captured, is the carbon dioxide and methane from the energy used to produce the electricity for the carbon-capture equipment." This also applies to the emissions generated producing energy to power up the grid. Realistically - we should have a BEV Color palette as well: a Grey Tesla, Blue Tesla, Brown Tesla, Black Tesla, and a Green Tesla. There's absolutely no difference in the electrons being generated to charge a battery, used to convert natural gas to hydrogen, power requirements to drive the SMR process and CCS or electricity used to power up electrolysis that produces hydrogen. Decentralizing off grid with carbon capture, utilization and transformation (CCUT) at the front end power supply is the only way to actually control the source of the electrons to substantially reduce or eliminate GHG emissions. This closed loop system is at the heart of the Utah Hydrogen Project.
It is widely accepted throughout the hydrogen industry as a benchmark of electricity used to separate H2 and O of water molecules via electrolysis requires 1.23 volts. Just as it is also widely accepted via industry standards it requires 50 - 65 kWhs (depending on manufacture) to produce one kilo of hydrogen via electrolysis. It is also accepted that  for every kilo of Hydrogen from natural gas requires 4.5 normal cubic meters/kg of hydrogen - (NREL REPORT page IV). It is also accepted by the leading manufacturer of modular SMR systems there are 9 kilos of CO2 produced for every 1 kilo of hydrogen produced. Similar - for every gallon of gasoline (6 lbs) burned in an engine of an automobile there are 19.6 lbs of CO2 produced. For diesel its 21 lbs of CO2 produced.
The fossil-based power generating industry - like the Renewable Energy industry - has specific scientific formulas and standards to determine the outcome of what feed stocks are used to produce energy, what type of power plant is used to generate the electricity post combustion and the emissions that are generated from each feed stock used. These equations also include the parasitic losses along the way of powering up a power plant, transmission line losses (line loss), operating efficiencies based on the technologies and thermodynamics of the system. The limitations of efficiencies and electrical dynamics also play into the RE industry but from a different time line in the equation of well to wheels. For example - one ton of coal has an inherent energy value of 6150 kilowatt-hour (kWh)/ton. Fossil fuel based power plant operate on a typical thermal efficiency for utility-scale electrical generators is around 37% for coal and oil-fired plants and 56 – 60% (LEV) for combined-cycle gas-fired plants. Considering the 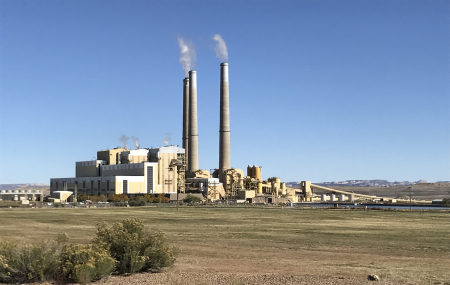 efficiencies losses along the way - the actual usable energy that is produced for consumption is 2,460 kWh of electricity generated per ton of coal - a 60% net loss. Therefore - by the time 1 kWh has hit your home or a charging station to charge the battery of your BEV for that matter - 60% of that energy has been lost to thermodynamics, plant efficiencies, plant parasitic load and transmission losses. Accordingly - 60% MORE emissions has also been produced for the final 2,460 kWhs that powers your home, car, commercial building or an entire industry.
Let's look at our Tesla Model 3 as a case in point. The Model 3 has a 100 kWh battery. BUT - It actually takes 115 kWhs to fill that battery to 100% due to the losses of electrical conversions from AC to DC and inherent efficiency losses of the technology. For a power plant to produce 115 kWhs and transmit it to your home to charge that Tesla 100 kWh battery 100lbs of coal had to be burned. Complete combustion of 1 short ton (2,000 pounds) of this coal will generate about 5,720 pounds (2.86 short tons) of carbon dioxide. Since we know 60% of the energy burning coal is lost to efficiency issues - 250 lbs of coal has to be burned to produce that 115 kWhs of usable energy for charging a Tesla Model 3. Since 2.07 lbs of CO2 is produced per pound of coal burnt to produce the electrons to charge your Tesla model 3 - 238.05 lbs of CO2 is produced charging a Tesla Model 3 to 100%. Considering the average driver travels 13,500 miles per year and the Tesla Model 3 has an factual 272 mile range per 100% fill up - that equates to 50 fill ups per year. Taking into consideration 50 fill ups requires 115 kWhs per 100% charge - the total amount of annual consumption equals 5,750 kWhs. Equating that 50 fill ups to total amount of CO2 produced annually using the national grid - charging a Tesla Model 3 will produce front end CO2 emissions of 11,902.5 lbs per year. The average gasoline ICE vehicle produces 4.6 metric tons of CO2 per year - or 10,141 lbs.
Like all energy conversions - there are losses. This involves mainly the First Law of Thermodynamics states that energy cannot be created or destroyed.  Alternatively, some sum it up as "the conservation of energy." Ultimately, the First Law of Thermodynamics is a statement that energy can be transferred between the system and the surroundings through the transfer of heat (q) or by the performance of mechanical work (w). ΔE = q + w - i.e. energy doesn't simply materialize or disappear. Any gain in energy by the system will correspond to a loss in energy by the surroundings, or any loss in energy by the system will correspond to a gain in energy by the surroundings.
There are great energy losses burning coal for power generation and electrical power transmission (60%). There is also great loss of energy burning natural gas as a fuel source in a gas turbine power plant - 55%. Nuclear power plants have an efficiency of 33% - 37%. Typical roof top solar panels are 14% - 17% efficient even though there are higher efficient solar panels but they're very expensive. Solar farms are usually in the 20% efficiency level. NASA solar panels on satellites are even more efficient at 40% but you will not have those on any rooftop or desert floors. Wind turbines have a theoretical efficiency of ~59.3% but on average operate at a 30% - 45% efficiency but at high winds can operate at 50% efficiency, cars may have a thermal efficiency of 30% - 35% but will only convert 12% - 30% of the energy into forward motion. The BEV power train may have a high efficiency (rating) of 85% - 90% but only convert actual power to the wheels of 77%. Coupled with the losses explained above, that number drops dramatically and closer into the range of HFCVs. A power plant may have a "nameplate capacity" of 500 MWs which is the maximum rating of the generators - but in actual energy transmitted over the copper cables may be only 350 MWs. These types of parasitic load losses also apply the same any form of energy conversion going on in a BEV as well.
Summation
There has been great strides made by the great state of California in cutting back on vehicular emissions that clogged the atmosphere of the state with so much haze it created amazing reddish sundowns. Zero-emission vehicle (ZEV) regulation started in 1990. Martin Eberhard and Mark Terpenning started Tesla Motors in San Carlos California in 2003 - the first ZEV Tesla Roadster was delivered February 2008.
Then came the beginning foundation of the hydrogen infrastructure in 1995 when the CaFCP first opened its doors for business. Across the waters Norway announced the HyNor hydrogen project in 2005. In California there were only a handful of pilot station projects being developed as a trial program until First Element officially opened its first station in December 2015. Hyundai introduced first ix35 FCEV and was delivered in June 2014 in Tustin, California. Toyota rolled HFCVs onto California's shore with the introduction of the Toyota Mirai November 2015 with 50 hydrogen powered vehicles. The Honda FCX Clarity was introduced November 2015. Seven years later there are 12,456 HFCVs on the roadways in the State of California.
Elon Musk - feeling the heat of increasing sales of hydrogen fuel cell vehicles in 2017 claims, "the tech is mind-boggling stupid.". But today - with numerous stations dotting the state and increasing sales of HFVS - it doesn't look like Musk is going to have the last laugh. There are several issues confronting the Tesla vehicles that have mysterious energy losses, batteries losing power and extravagant cost for replacement. But there are advantages to both technologies in different applications. With the price of hydrogen still being high - BEVs in general are still carving a pathway to the bank. The problem is the front end emissions generated using the grid for charging. Electrons charging Teslas being generated over the grid from fossil based power plants leaves the buyers of ZEV vehicles with front end CO2 emissions - anything other than Zero Emissions.
Hydrogen is a social atom - it doesn't occur singularly out in the open as a molecule - H2. Like oil - it has to be extracted from its host. The world has been extracting hydrogen from natural gas in bulk for decades while producing chemicals, drugs, fertilizer and gas. Hydrogen is an evasive molecule that requires a series of steps to produce, compress, transport, store and finally convert to energy. But this is not much different than drilling for oil, transporting to a refinery, processing to gasoline, transporting to port, shipping, transporting again to distributors and finally converting to forward motion in ICE vehicles. BEV owners and the industry have a funny way of overlooking the complexities and the front end emissions that occur in producing electrons that are sent over long distant transmission cables that eventually end up charging a battery. Since 60% of the US grid is powered by Fossil fuels - charging a BEV over the grid is anything but Zero emissions.
Since 2005 hydrogen has been taking on a new value - as one solution to California's diminishing air quality due to vehicular emissions. After Elon Musk took over as CEO of Tesla Motors and the original founders were removed - Musk's claims of energy and technological inferiority of hydrogen compared to his BEV, instead of following the original path of Tesla Motors taking on gas guzzling Detroit - he pegged the "us against them" - BEV vs Hydrogen Fuel Cells. This War of the Currents has inspired markets around the globe. Now over 30 countries have signed on to develop hydrogen economies. Mergers and acquisitions, new partnerships, coalitions and alliances are springing up weekly. There are now over 200 hydrogen projects of varying sizes at every corner of the planet. The international Hydrogen Council - some of the largest companies in the world - has grown to 130 global members since 2017. Many of these same companies cross link to the CaFCP.
There are two physical hydrogen storage methods used in the industry: H2 gas compressed to high pressure (350, 700 bar) and liquid hydrogen (LH2). Theoretical minimum energy requirements are determined from energy differences using the standard properties of “normal” hydrogen (25% para-H2 spin isomer) as reported by the National Institute of Standards (NIST) [1]. In all cases it is assumed that H2 gas is initially generated at 20 bar (290 psi). The theoretical energy to compress hydrogen isothermally from 20 bar to 350 bar (5,000 psi or ~35 MPa) is 1.05 kWh/kg H2 and only 1.36 kWh/kg H2 for 700 bar (10,000 psi or ~ 70 MPa). Greater compression energies are required to fill vehicles in practice due to compressor inefficiencies and heating during fast fills. DOE Technology Validation Project data for compression from on-site H2 production is 1.7 to 6.4 kWh/kgH2. Additional energy required for pre-cooling (as cold as -40 C)to ensure on board fast fill temperatures are 85 C or lower can be modest (0.15 kWh/kg H2). Based on these specs from the DOE - if we compare the energy capacity of batteries vs hydrogen we see the extreme differences. A Tesla Model 3 battery has an energy density - according to Elon Musk recently claims, The highest energy density in the market, "260 Whs per kg" (.75 MJ per kg). As a side notes - the Powerwall has a mass of 100 kg which puts the mass energy density at 0.36 MJ/kg. This value puts the Powerwall right in the rand for Lithium-ion batteries. Hydrogen on the other hand ranks the champion at 120 MJ/kg. Hydrogen has almost 2X the energy density than the best leading Lithium ion battery in the market.
In 2018 - Neoen installed a $60 million Tesla 100 MW battery back up system that had 129 MWh storage capacity and "takes up less than 10,000 square meters of land". That equates to 1 MW of power for roughly 5 days (120 hours) OR 10 MWs of power generation for 12 hours OR 100 MWs (30,000 homes) for only 1.2 hours. But keep in mind - this massive battery array has to be constantly charged up by the Hornsdale wind farm once the battery power has been discharged. That costs money. On September 23, 2021, the Australian government sued Neoen SA, saying the French firm's Tesla "Big Battery" in South Australia did not provide backup power during four months in 2019 for which it had received payment. SO it seems not everything comes up Roses in the World of Tesla Battery storage.
At 700 bar - 42 kilos occupies one cubic meter. At this pressure, 5 kg of hydrogen can be stored in a 125-liter tank. It becomes obvious storing energy for future use hydrogen has the advantage. If we converted 10,000 square meters into cubic meters by rebuilding the above ground battery array and installing underground storage tanks then we can compare the space needed for battery energy densities of the Tesla 129 MWh facility to 129 MWhs of hydrogen storage. Assuming a 200 feet long X 50 feet wide battery facility. If we condense that space to a storage tank dimensions 50 feet long X 20 feet wide X 10 feet high (4 X less land mass) - this tank would hold 283 cubic meters of hydrogen. Since there are 42 kgs per cubic meter this tank would hold 11,886 kilos. Each kilo of hydrogen contain 33.33 kWhs X 11,886 kgs = 396,160 kWhs OR 396 MWhs of storage. That's 3 times more energy storage than a Tesla Battery array in 4 times less land area. Even if we consider the efficiencies of a large Fuel Cell array at 60% - we lose 30% of our energy density of the hydrogen. That still equates to 237.6 MWhs of hydrogen power compared to the 129 MWhs of the Tesla Lithium Battery array. Lest we forget the issues of having to replace those $60,000,000 Tesla batteries at some point.
BEV advocates claim superiority in the efficiency arena. They also claim "clean and green Zero emissions". Yet in the same breath - they hit below the belt in pointing out the numerous processes that are involved in producing hydrogen, compressing, transporting and storing hydrogen AND the numerous GHGs attributed along the pathway of using fossil base resource in its production. Unbeknownst to most - the entire BEV equation is heavy laden with vast amounts of CO2 and GHGs (depending on the grid) with extreme losses of efficiency even before one electron is transferred into the battery during charging. Let alone - the claim to fame of being so efficient is never coupled with the costs incurred of producing the electrons BEFORE they go into the battery - nor in the same discussion is the complete loss and necessity of the $12,000 replacement charge after the 8 year warranty is expired.
There is another - not so small detail - that is not included in any BEV charging equation. The direct costs related to producing the energy from the energy resource. Namely wind turbines and solar panels in the RE space. So lets take a look. The newest Tesla V3 Supercharging station has 39 charging stations and 576 solar panels that produces 1,207.5 kWhs average per day. Since the Tesla Model 3 has a 100Kwh battery then only 12 cars can be charged up from 0% - 100% during the entire time the station is in operation - during the day. No where does it state the cost of the station. BUT - if we look at another energy source we know the price of and the precise energy output - we can easily calculate the entire cost chain.
Electrical Energy costs are defined by kWhs, MWhs, GWhs and TWhs. A 4 MW wind turbine can only produce on average of 14,716,800 kWhs throughout the year at a cost of $5,000,000 for the wind turbine. That is broken down to 40,320 kWhs each day. Charging at a Tesla Super Charging station runs $.25 per kWh. Multiplying that out the most that one wind turbine can produce in electrical financial returns is $10,080 per day OR $3,679,200 per year. If that same 40,320 kWhs was used to produce hydrogen - considering 50 kWhs per kilo - it would produce 806 kilos per day. Considering a retail cost of $12 per kilo of hydrogen - the daily electrical production of that wind turbine equates to $9,676.8 per day OR $3,532,032 per year. The great advantage is as long as that wind turbine is spinning - its creating hydrogen. The Tesla Supercharging station is not producing income from charging cars all 5.35 hours of the day. Therefore - producing hydrogen is a much larger revenue stream that charging BEVs. AND - HFCV owners don't have the cost of replacing a battery.